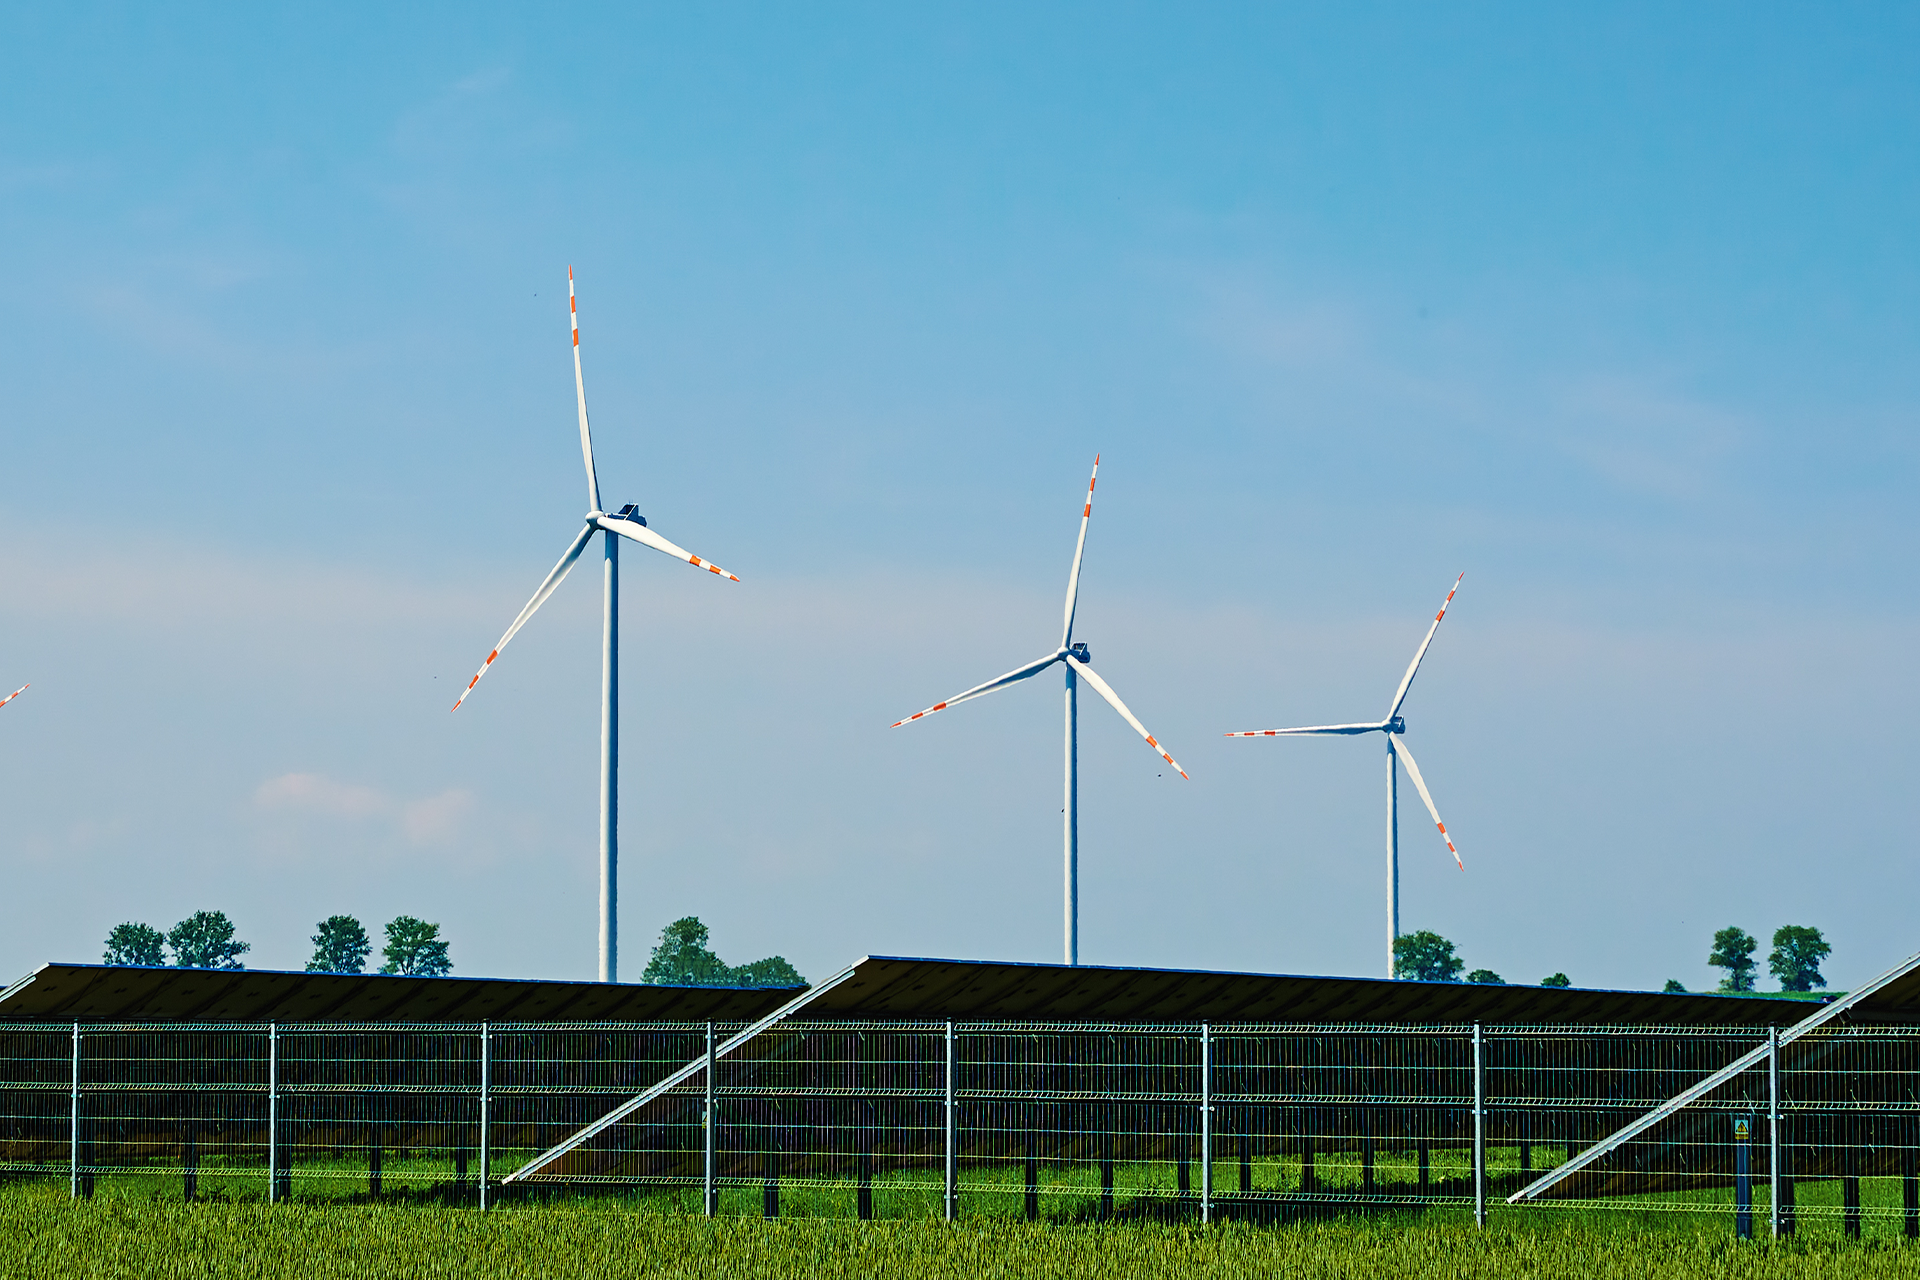
The combined installed capacity of utility-scale solar (11.34%) and wind (11.83%) now represents 23.17% of the U.S.’s total utility-scale generating capacity. When including small-scale solar (e.g., rooftop systems, estimated at 25-30% of total solar capacity), renewables account for roughly one-third of the nation’s generating capacity. Adding hydropower (7.62%), biomass (1.07%), and geothermal (0.31%), the renewable share climbs to 32.17%, a significant leap from a decade ago when renewables made up just 16.6%.
FERC’s data shows solar’s meteoric rise, with its share of generating capacity increasing tenfold since 2014. Wind has more than doubled in the same period. This growth is outpacing earlier forecasts, with actual solar additions in 2024 exceeding FERC’s projections by 11.2% and wind by 2.4%.
A Bright Future for Solar and Wind
FERC’s “high probability” forecasts predict continued dominance for renewables. By July 2028, solar is expected to account for 17.1% of U.S. utility-scale capacity, surpassing coal (12.1%) and closing in on natural gas (40.2%). Wind is projected to reach 12.6%, also outpacing coal. Over the next three years, FERC anticipates 92,660 MW of new solar capacity—four times the 23,136 MW projected for wind—and 116,340 MW of total renewable additions, including hydropower (583 MW) and geothermal (92 MW). Meanwhile, coal and oil are expected to decline by 25,017 MW and 1,572 MW, respectively, with no new nuclear capacity planned.
Adjusting for capacity factors—59.7% for gas, 34.3% for wind, and 23.4% for utility-scale solar—the electricity generated by new solar capacity will likely be six times that of new natural gas, while wind’s output will more than double gas. If small-scale solar is factored in, total solar capacity could exceed 325 GW by 2028, pushing renewables past 40% of total U.S. capacity.
Overcoming Policy Challenges
Despite this momentum, renewables face hurdles. The Trump administration’s policies, including a January 2025 executive order freezing permits for wind projects and halting $8 billion in clean energy investments, pose risks. However, the economic case for renewables remains strong. A 2024 report from the International Renewable Energy Agency noted that clean energy is now the cheapest power source, driving global investment to $780 billion in 2025.
The U.S. added a record 64.1 GW of generation capacity in 2025, with 93% from solar, wind, and battery storage, per the U.S. Energy Information Administration. This growth, fueled by falling battery costs and rising demand from AI data centers, shows renewables’ resilience despite policy setbacks.
Why Solar and Wind Are Winning
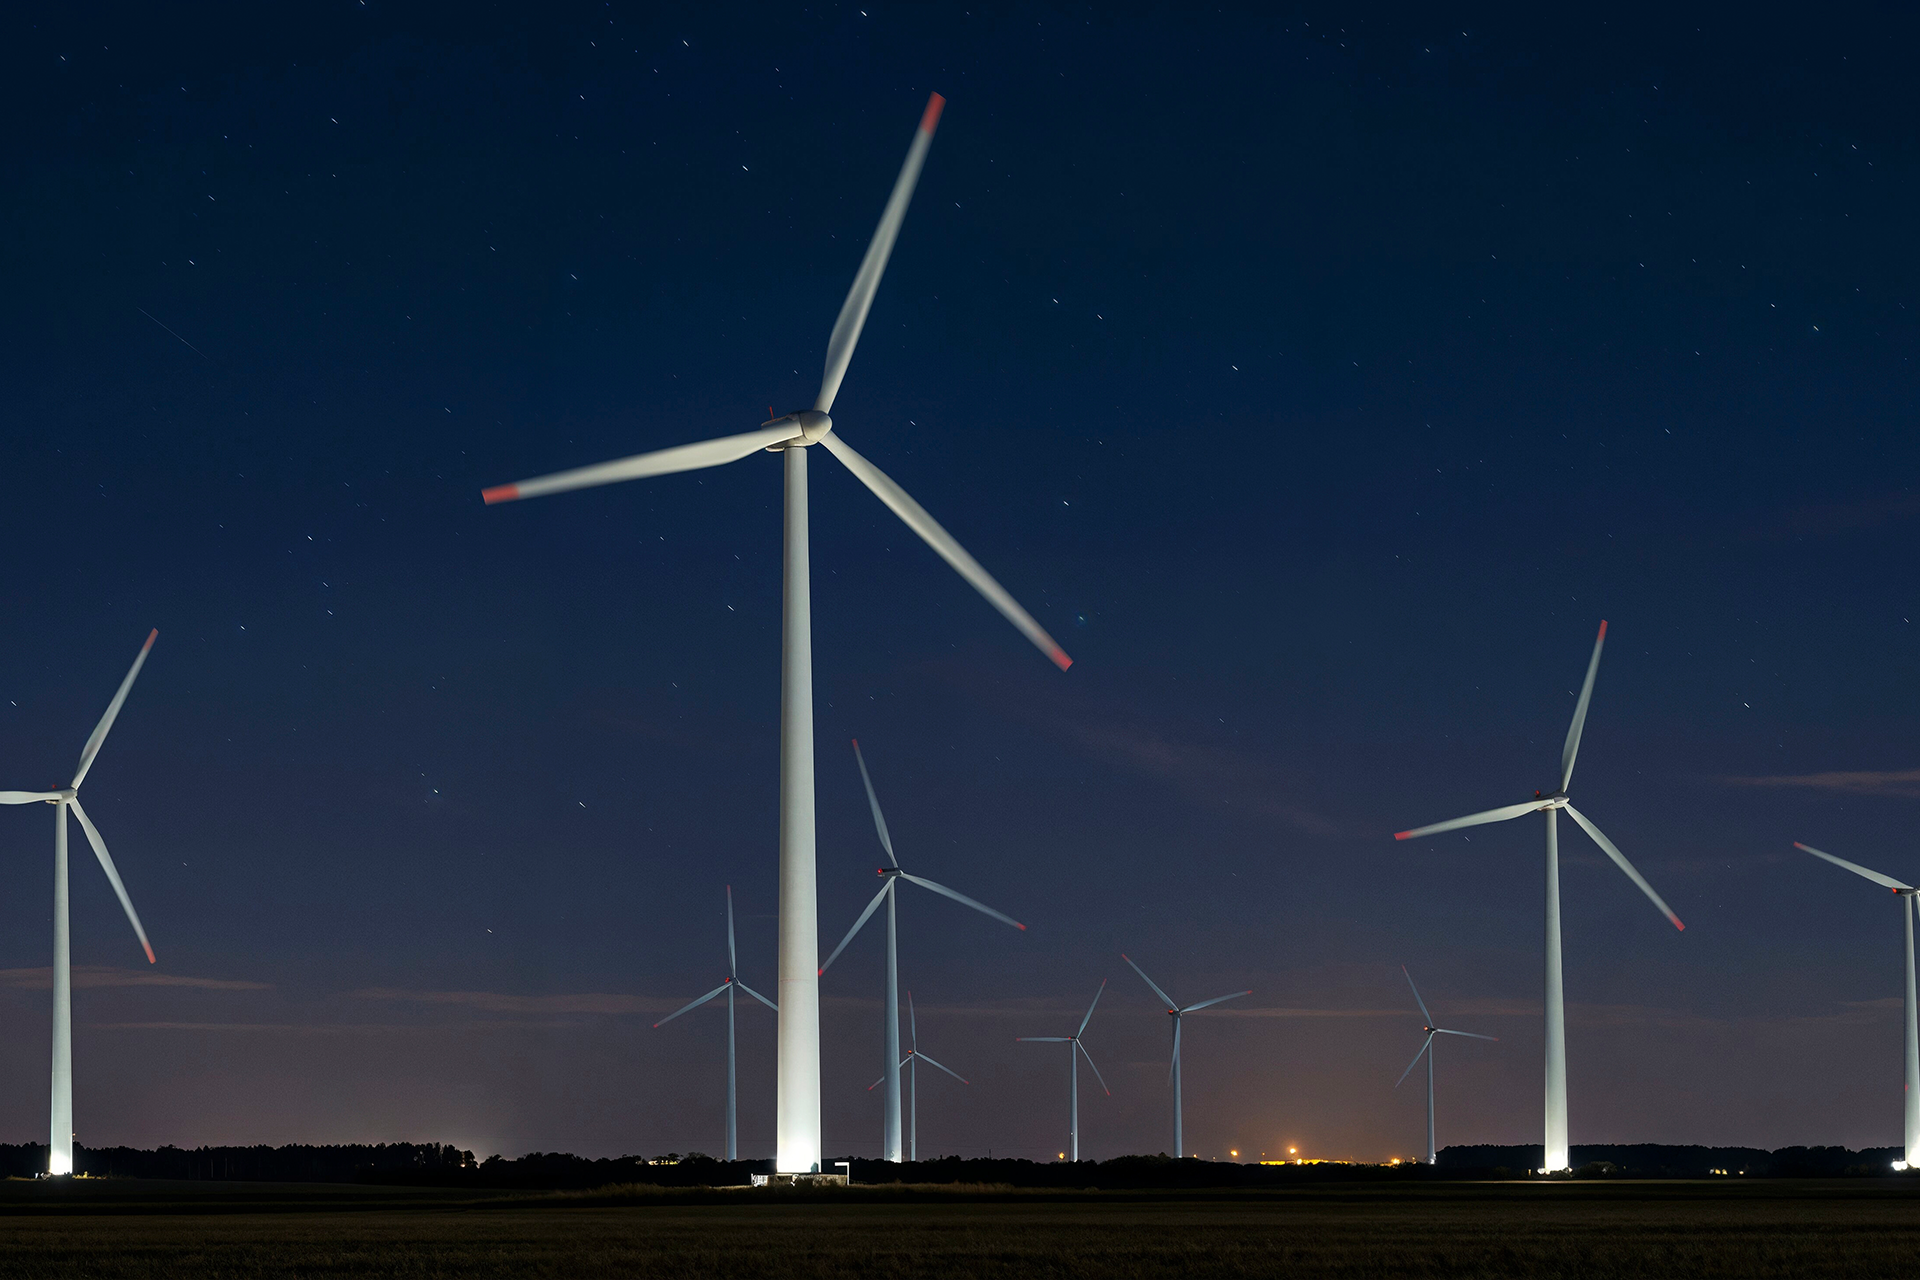
Several factors drive this renewable surge. Solar and wind are now cost-competitive, with battery storage costs dropping 20% in 2024 to $139/kWh. Their scalability and flexibility—unlike geography-dependent hydropower—make them ideal for diverse regions. Solar’s consistent lead, with 20-22 months of topping new capacity additions, reflects technological advances like improved panel efficiency and battery integration. Wind, rebounding from a low 5.2 GW in 2024, is set to grow with projects like GE Vernova’s 308 MW Texas wind farms.
Small-scale solar, often overlooked in FERC data, adds significant capacity. Including these systems, renewables already power about one-third of U.S. electricity, with solar and wind outproducing coal and nuclear in early 2025.
The Road to a Cleaner Grid
The rapid rise of solar and wind signals a transformative moment for U.S. energy. As renewables approach 40% of generating capacity by 2028, they’re poised to challenge natural gas’s dominance. Continued innovation, like second-life EV batteries for grid storage and sodium-ion alternatives, will further lower costs and enhance reliability.
For consumers and policymakers, the message is clear: renewables are not just viable but essential. Supporting permitting reforms and investment in clean energy infrastructure will ensure this momentum continues, paving the way for a sustainable, resilient grid.